<p>The Z index is an index describing the degree of flood-drought. The data contains two CSV files, which are Z index data values and grid dot center coordinates. The Z index data file has 2971 columns, each column corresponding to a grid point. </p>
| data size | 3.0 MiB |
|---|---|
| data format | CSV format |
| Coordinate system |
Daily precipitation, minimum and maximum temperature data are from the CN05.1 dataset, which contains high-resolution daily observation grid data from more than 2400 national-level meteorological stations in China covering basic benchmarks and general meteorological stations.
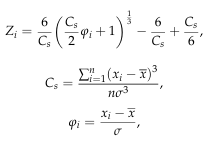
The Z index is calculated as follows, where i represents the current monthly index, n represents the number of months, Cs is the skewness coefficient, is the average value, and is the standard deviation.

This work is licensed under a
Creative
Commons Attribution 4.0 International License.
| # | title | file size |
|---|---|---|
| 1 | 1961-2020新疆Z指数格网数据.csv | 2.9 MiB |
| 2 | 1961-2020新疆Z指数格网点中心坐标.csv | 30.0 KiB |
©Copyright 2021-. Xinjiang Institute of Ecology and Geography, CAS
No. 818 Beijing South Road, Urumqi, Xinjiang, China, 830011